


4 minute read
The SDGs are a universal agenda of sustainable development, calling on all nations to pursue a holistic strategy that combines economic development, social inclusion, and environmental sustainability.
- The SDG Index and Dashboards synthesize insights for policymakers and the public.
- Each country is measured on a spectrum to see where it stands in achieving the SDGs.
- Also: read AVPN’s 5 Insights on Social Investment in Asia to take actionable recommendations.
To track the SDGs, the UN Statistical Commission has recommended over 230 official indicators. Of these, some 150 have well-established definitions, but not all have data for the majority of UN member states. Although countries report well on socioeconomic SDGs, reporting was particularly weak on the environmental SDGs 12-15 and goal 17 (international partnership).
Since 2016, the Sustainable Development Solutions Network (SDSN) and the Bertelsmann Stiftung have been issuing an annual global unofficial SDG Index and Dashboards to synthesize available metrics on the SDGs. The data are presented in a way that is informative, easy-to-use, and interesting for policymakers and the public. This year’s edition includes revised and additional metrics and introduces several refinements to the methodology. As a result, results are not comparable with the 2016 edition.
We have normalized the indicators for each SDG so that they indicate a country’s position on a 0-to-100 spectrum from the “worst” (score 0) to the “best” (score 100). So a country that scores 75 on a particular indicator is three quarters towards achieving the SDGs. This will enable countries to take stock of where they stand with regard to achieving the SDGs, thus helping countries set priorities for early action.
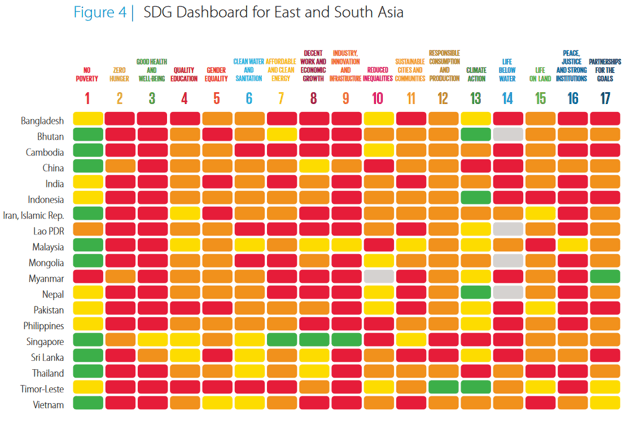
The above graphic is our dashboard for East and South Asia. A green rating on the SDG Dashboard denotes SDG achievement, and is assigned to a country for a given SDG only if all indicators under the goal are rated green. Yellow, orange and red indicate increasing distance from SDG achievement.
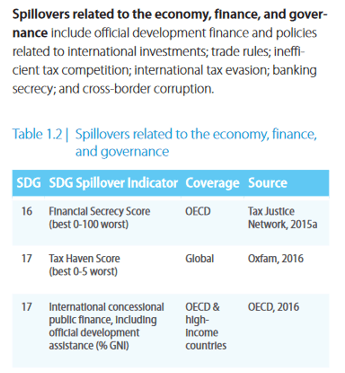
The SDGs rightly emphasize a universal agenda that requires all countries – both rich and poor alike – to take decisive action to support sustainable development. In the 2017 report, we note that development patterns of the rich countries generate adverse “spillovers” that may hinder the ability of poorer countries’ to achieve the SDGs. For example, high consumption levels, banking secrecy and tax havens, and weapons exports by the rich countries may inhibit sustainable development in poorer and more vulnerable countries. The graphic below illustrates the indicators added to account for financial spillovers.
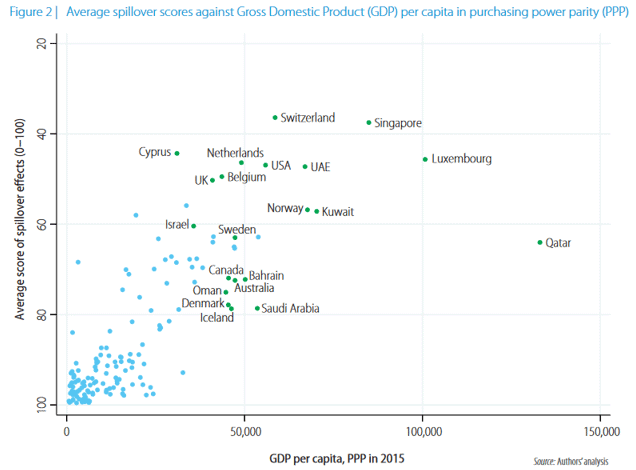
The following graphic plots per capita income against spillovers (the higher a country is on the vertical axis, the greater its negative spillovers). It demonstrates that richer countries generate greater negative spillovers. They need to address negative spillover effects in their SDG implementation strategies and reporting.
Many of these adverse spillovers tend to be neglected or poorly measured in official development statistics.
We hope this report provides useful suggestions for filling some conceptual and data gaps and for supporting future efforts to close these gaps. We believe that accurate measurement of international spillover effects is important to foster the political consensus around the SDGs as a universal agenda and to ensure effective implementation strategies by all countries.